User manual
1. Introduction
Large-scale metabolite quantification is a challenge in targeted metabolomics studies. Targeted Metabolome Batch Quantification (TMBQ) is a web based platform for high throughput and customized targeted metabolites quantification with minimal manual intervention. There are 6 functional modules in the main workflow of TMBQ, including data reading and pretreatment, peak identification, intensity calculation and correction, standard curve fitting, concentration calculation, and results exportation. There are 2 additional modules assisting for key parameters auto-tuning and for unit conversion. Currently, TMBQ only supports UPLC/TQ-MS based targeted metabolomics data acquired from Waters or Agilent corporations. Data formats from more vendors will be supported in the near future.
2. Workflow and main features
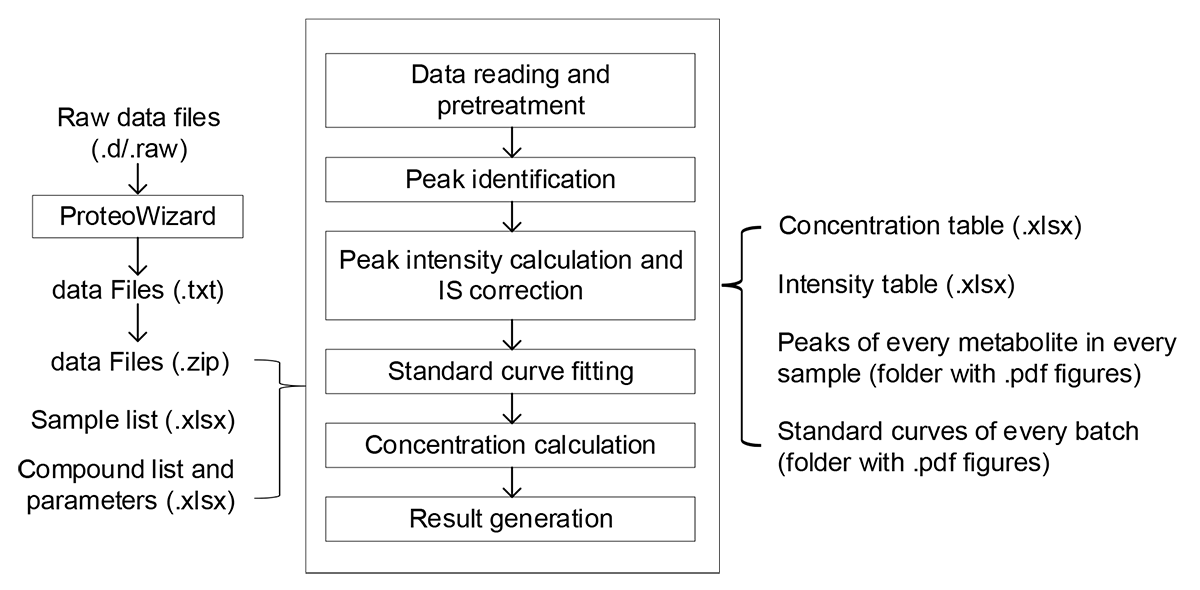
- Fulfill the connection between raw LC/MS data to concentration matrix;
- A new algorithm (dynamic range and recursive calibration, DRC) with comprehensive consideration of sample concentration range, goodness of fit, and number of points included;
- Parameters for peak picking and intensity integral are independent, more accurate;
- Simple inputs. One data file (.zip) and 2 configuration files (.xlsx) are required;
- Results are fully compatible with numerous downstream applications;
- Support raw data of UPLC-TQ/MS instruments from Agilent and Waters (format conversion by Proteowizard is required);
- Cluster servers and multithreading technology are employed for high speed computation (300+ metabolites in 100+ samples, ~ 5 minutes).
3. Input files preparation
TMBQ requires the import of the following files:
- a sample list (.xlsx format),
- a compound and parameter table (.xlsx format), and
- a raw data file (.zip format).
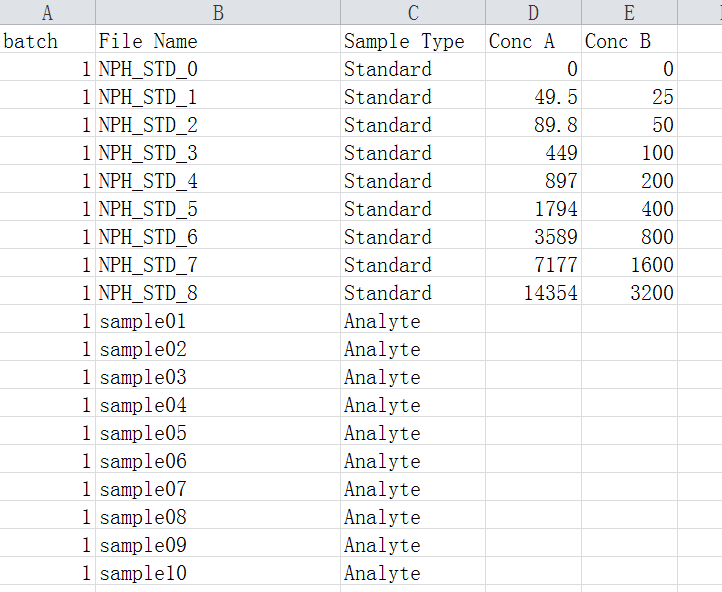
3.1 The sample list file
The sample list file contains a list of batch index (1, 2, …), raw data file name, sample type (Standard or Analyte), and concentrations of standards. At least one concentration gradient (e.g. Conc A) is required and more than one concentration gradients (maximum 50) are allowed. In each batch, at least 2 standard samples and 1 analyte sample are required.
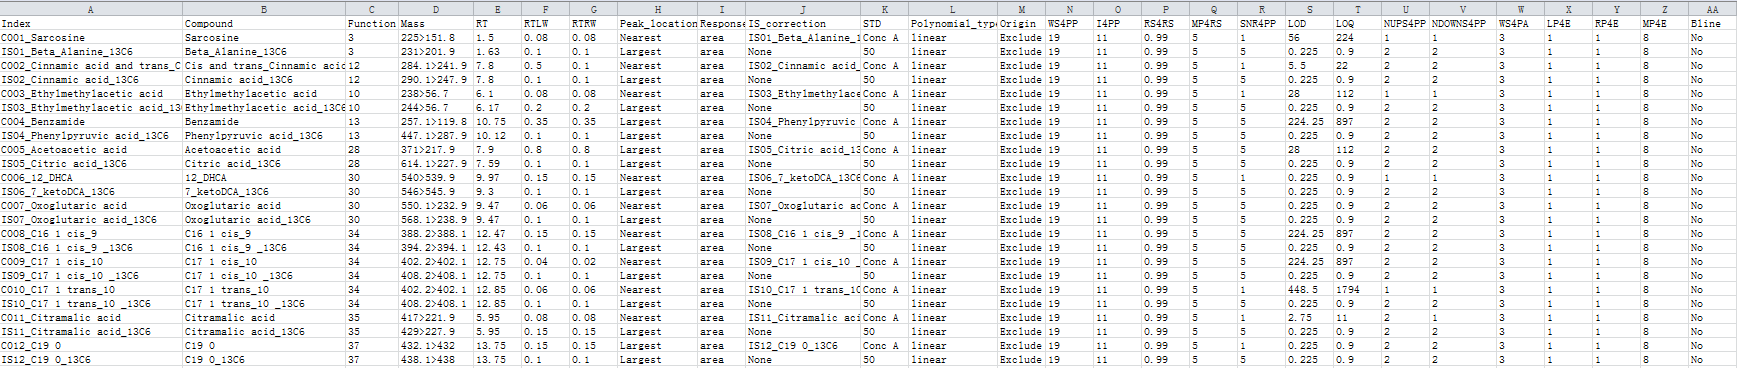
3.2 The compound and parameter table file
The compound and parameter table contains a list of compounds for quantification with detailed processing parameters (one compound per row). The final results depend on the parameters in this file and great efforts are suggested to be devoted to an optimal parameter table. The permitted and recommended values of all the parameters are listed below.
Missing values are not allowed in the whole table. Duplicated contents are not allowed in column 1 and 2. The indexes of internal standards should be started by “IS”. The values in columns "ws4pp", "i4pp", "mp4rs", "snr4pp", "nups4pp", "downs4pp", "lp4e", "rp4e", "mp4e", and "function" should be integers larger than zero. The values in columns "ws4pp" and "ws4pa" should be odd numbers. The values of “IS_correction” column should be “none” (do not perform IS correction) or any IS index (consistent to one of the index in column 1). The values of “STD” column should be consistent to the header of column D, E, …. of the sample list file. All the values are case-insensitive.
The final generated table should look like:
3.3 A raw data file
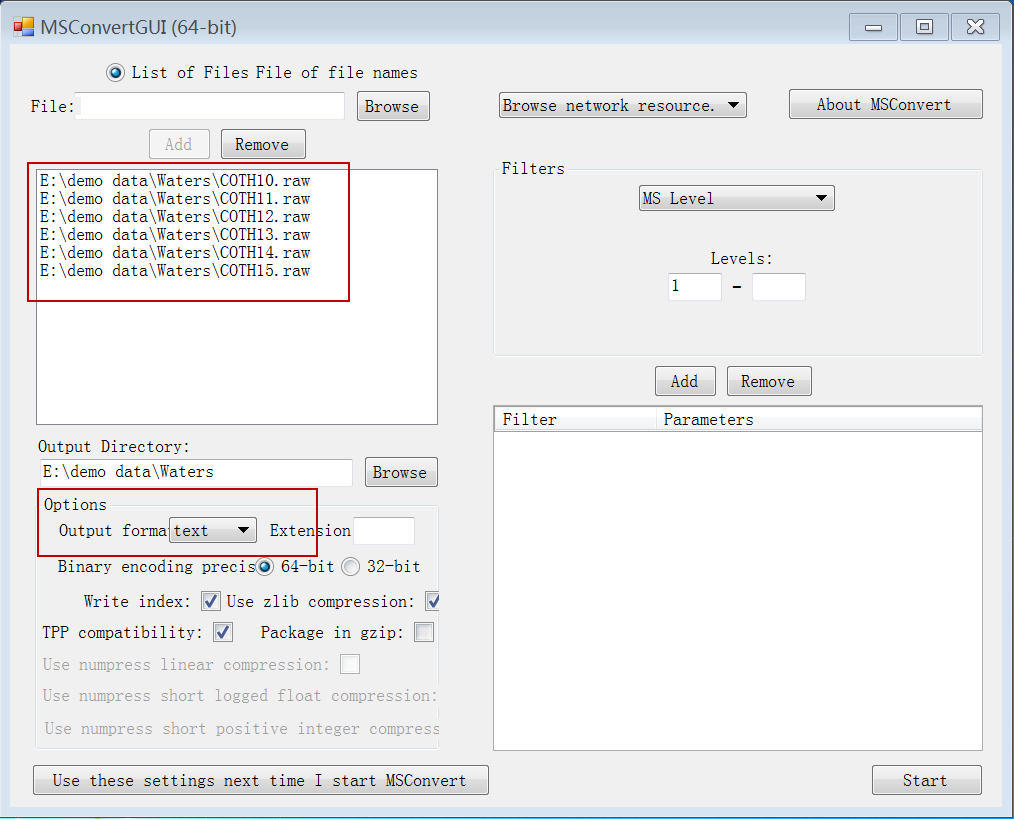
3.3.1 Data format conversion
Convert the raw data files (e.g. Water .raw or Agilent .d files) into .txt format using ProteoWizard (version 3.0.6150,
http://proteowizard.sourceforge.net/
). Please follow the conversion setting as following. The conversion of Waters .raw files can also be done by the company-provided tool “Data bridge” which will be installed automatically together with Masslynx (Waters, US).
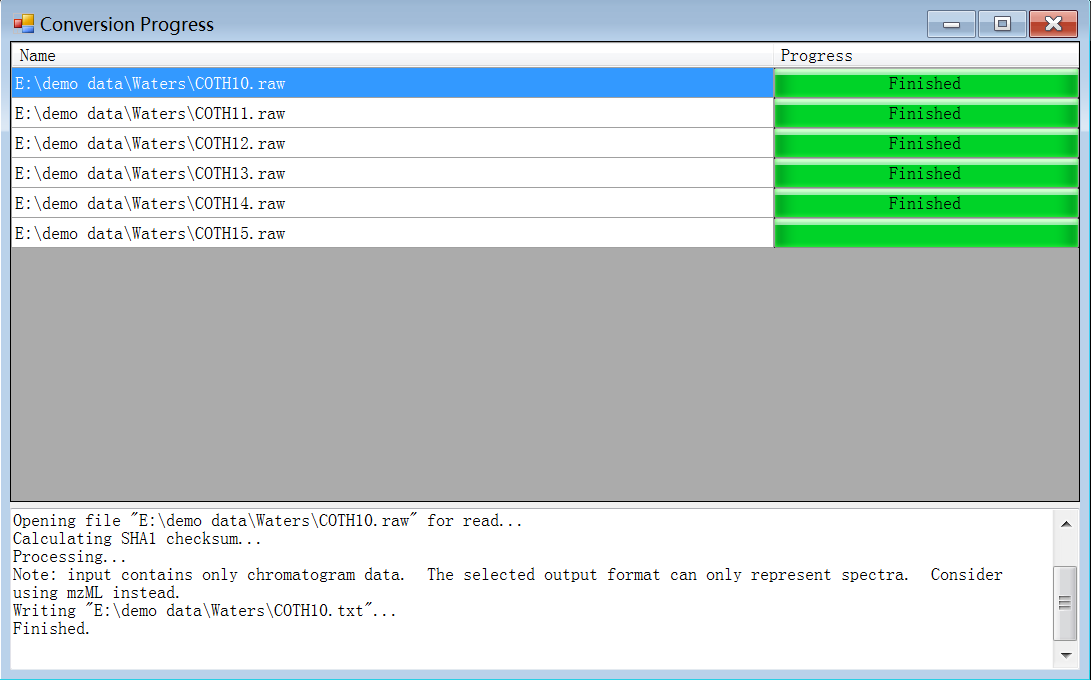
3.3.2 Data files compression
Compress all the converted data files (.txt) in a .zip file. This is the raw data file ready for processing.
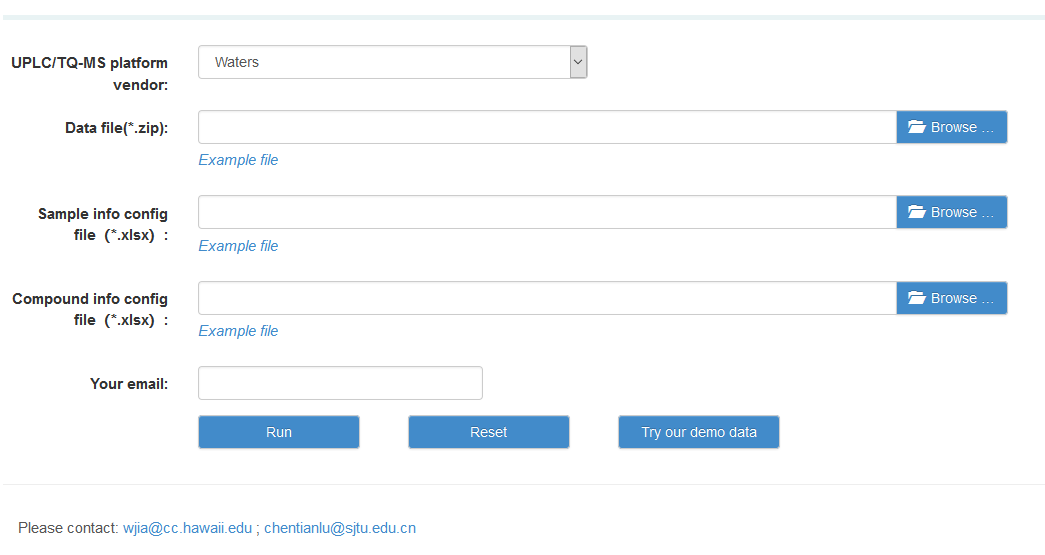
4. The use of TMBQ webserver
Please visit TMBQ webserver here
http://119.136.25.134:9011/. Currently, common web browsers such as IE, Chrome, Edge and Firefox are supported.
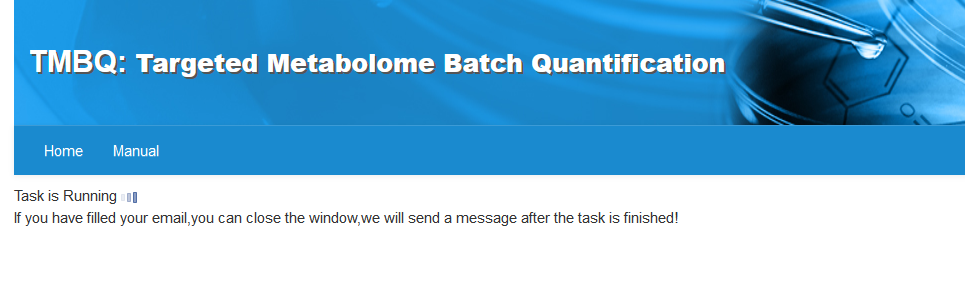
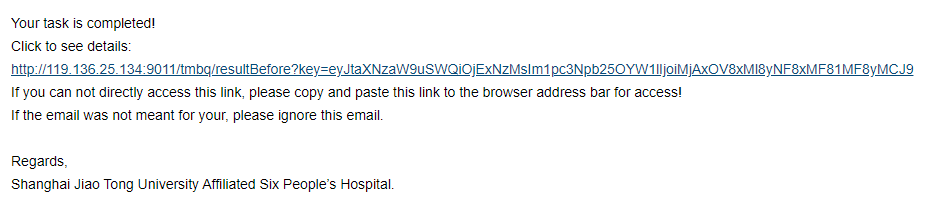
An active email address is suggested to be provided as a notification email will be send to the address you provided when your project is finished. You can download the result by the link in the email which will be valid for 3 months. Otherwise, if you haven’t filled in your email, please do not close the webpage and keep waiting. A save window will pop-up once the task is done.
5. Interpretation of analysis results
The analysis result contains 2 folders and 2 .xlsx files, named as "plot_peaks", "plot_regress", “concentration.xlsx”, and "intensity.xlsx" respectively.
The file named “concentration.xlsx” contains 1) concentrations of every compound in every sample, 2) all the user defined parameters, and 3) R square and formula of calibrated curves, and 4) some simple statistical results (mean, S.D., RSD%, etc). The reliabilities of the sample concentrations are colored. It looks like following.
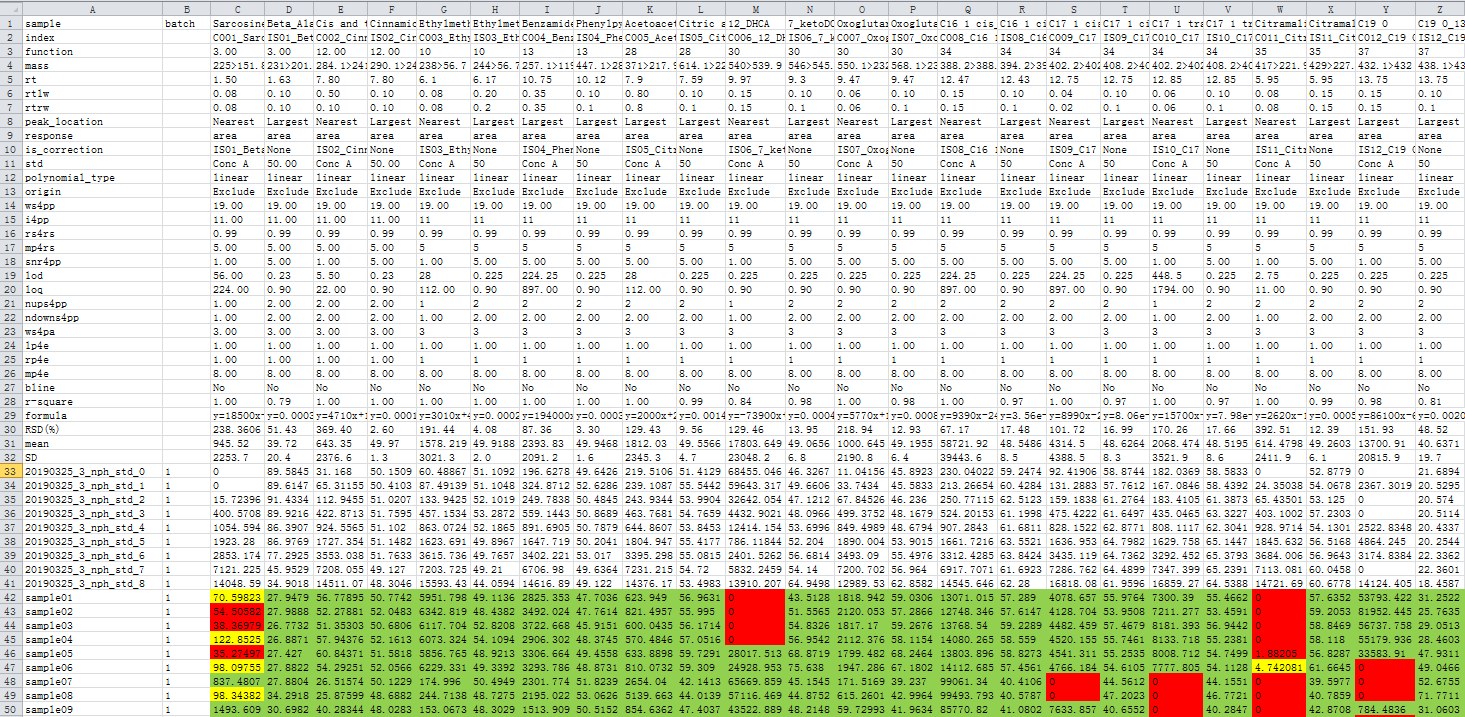
The file named “intensity.xlsx” contains intensities of every compound in every sample. It looks like following.

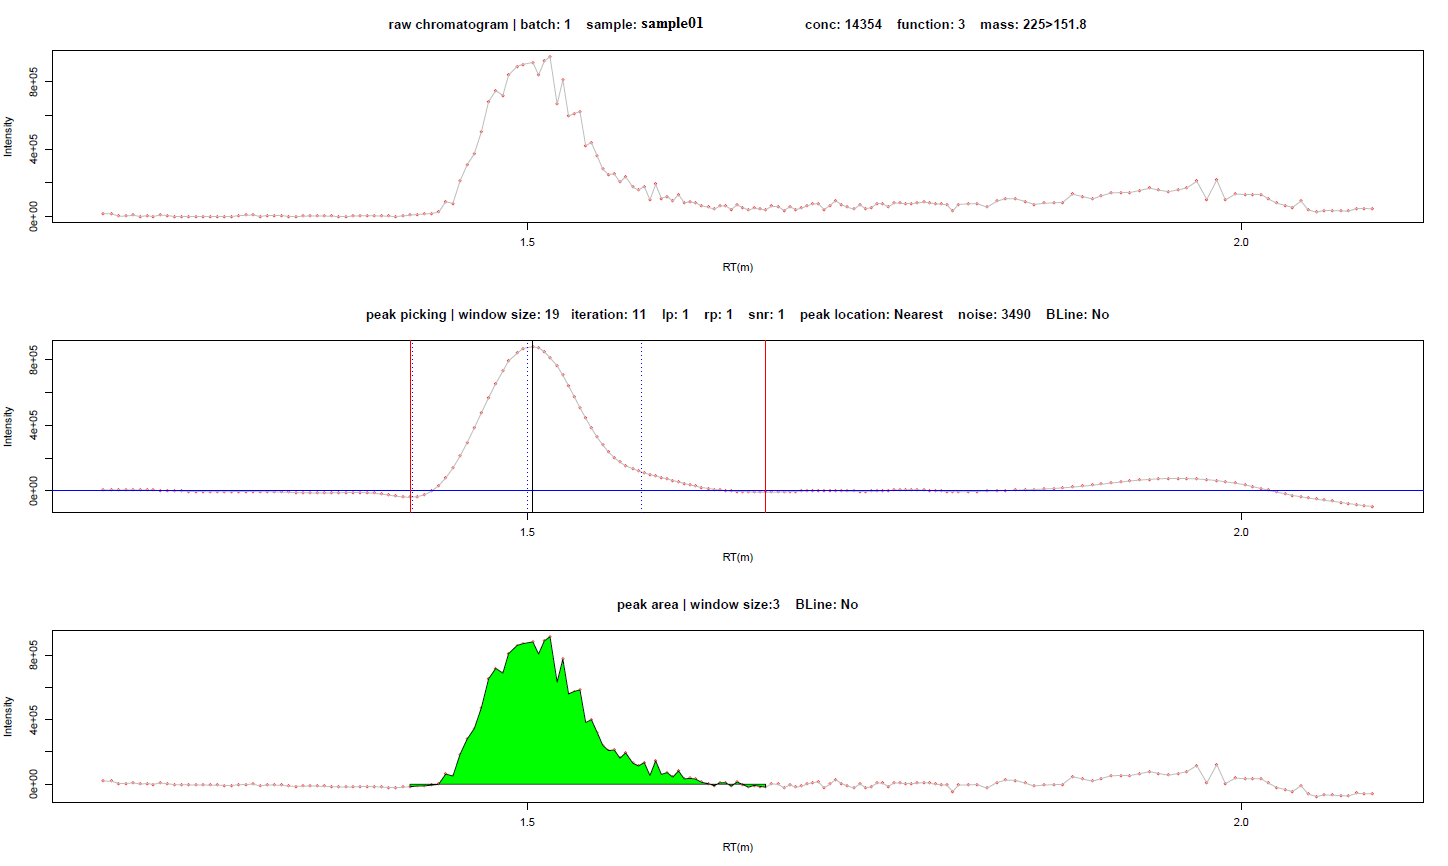
The peaks for every compound are saved in the plot folder, one file per compound. Take the compound sarcosine in sample “sample01” as an example. The raw signal of the target compound (extracted by corresponding function and ion pair), signal after smooth by user defined parameters, and signal used for intensity calculation (integral area is colored in blue) are as following respectively. The basic information and some key parameters are displayed in the figures. Each red dot means a scan point of detection. In the middle figure (the smoothed signal for peak picking), the dot-dash lines in blue are user defined RT window, the red solid lines indicate the rising and ending points of target peak, and the solid black line indicates the summit of the peak.
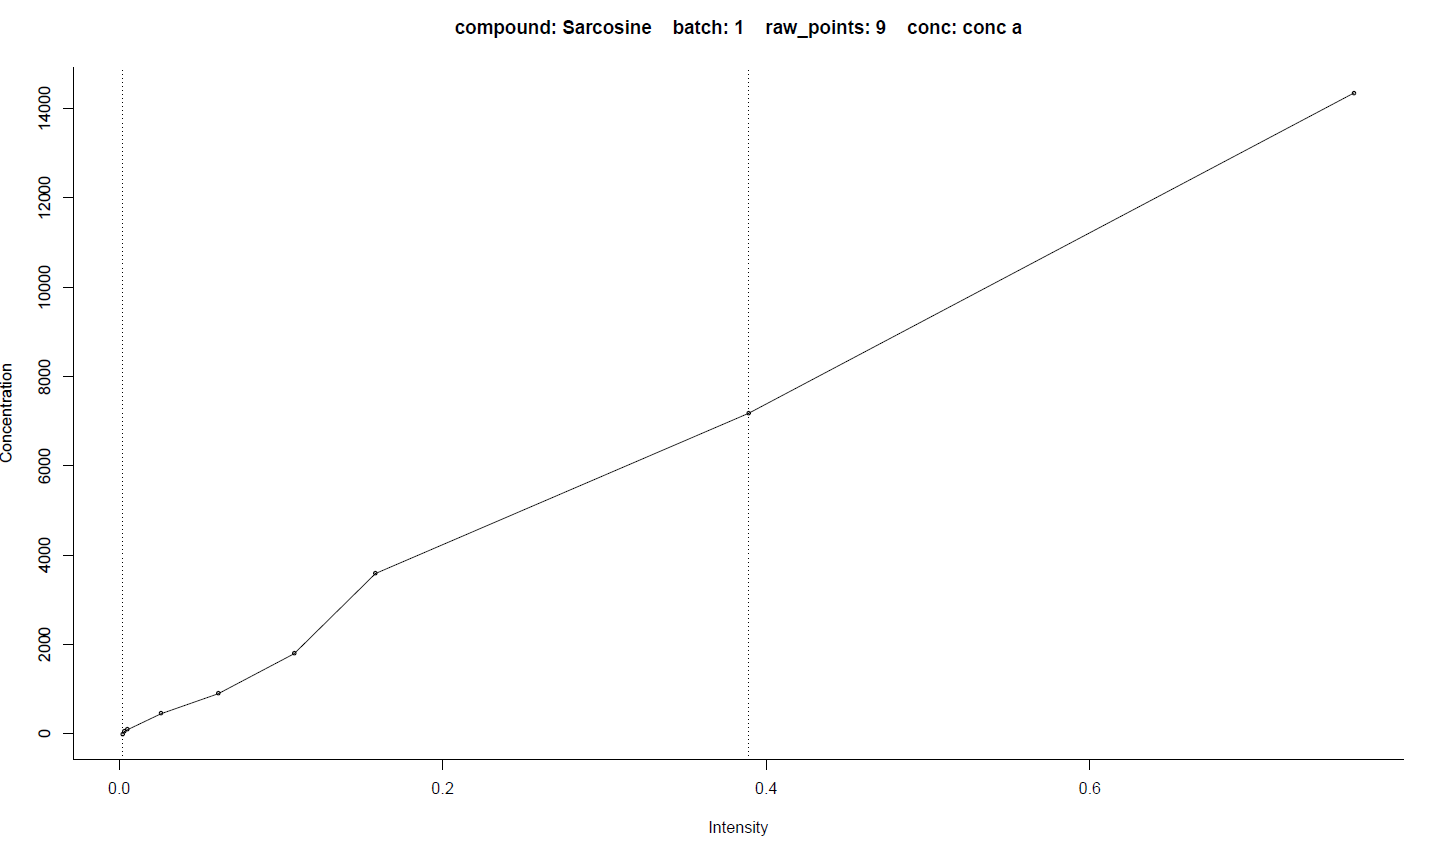
The fitted curves for every compound of every batch are saved in the plot-regress folder, one file per compound. Take the calibrated curve for sarcosine in batch1 as an example. There will be two figures related to calibration. The first one is the intensity-concentration line chart of all the points (circle) ready for curve fitting. The dot-dash lines indicate the points and range used for final calibration, determined by the
Dynamic range and recursive calibration (DRC)
algorithm. The second figure is the calibrated standard curve with all samples (cross). The two solid lines indicate the minimum and maximum intensities of samples. The formula, R square, and some parameters are also displayed on the figures.

6. Postscript
As far as we know, TMBQ (Targeted Metabolome Batch Quantification) is the first freely available tool designed to fulfill the connection between UPLC/TQ-MS raw data and targeted metabolome quantification. It covers almost all the widely used functions and key parameters provided by existing commercial tools (e.g. TargetLynx and MassHunter). The outputted figures and tables are also similar to them. Therefore, it is not hard for researchers to switch from existing tools to TMBQ. To promote the levels of automation and standardization, interactive modification of compound peaks, integral areas, and sample points involved in standard curves fitting are not supported. Consequently, TMBQ is a good complement to existing tools, especially for large-scale and multi-batch applications and those with high requirements for speed and reproducibility.
To improve the quality of standard curves which is crucial for following concentration computation, a new algorithm was used in TMBQ. Cluster servers and multithreading technology are employed. The parameters in the compound list file are crucial to the final result and so deserve great efforts for tuning. This may be the most time consuming step of TMBQ strategy. Once the parameters are determined, only small adjustments of few parameters (e.g. RT) are needed for subsequent analysis unless sample type or analytical protocols are different.
While we still face many challenges ahead, ongoing efforts are devoted for performances improvement such as supporting more instrument and data types, designing better algorithm for peak identification and curve fitting, tuning key parameters by machine learning. Bug reports and various suggestions are welcome to
chentianlu@sjtu.edu.cn and wjia@cc.hawaii.edu.